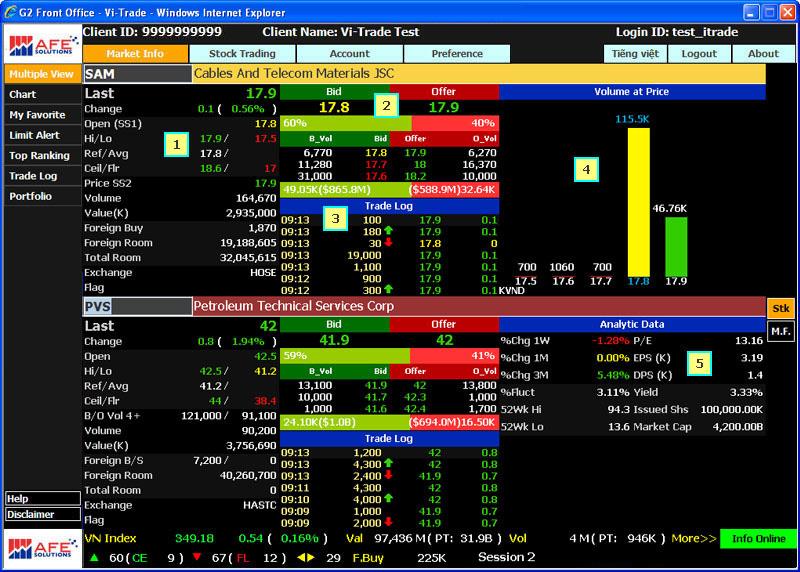
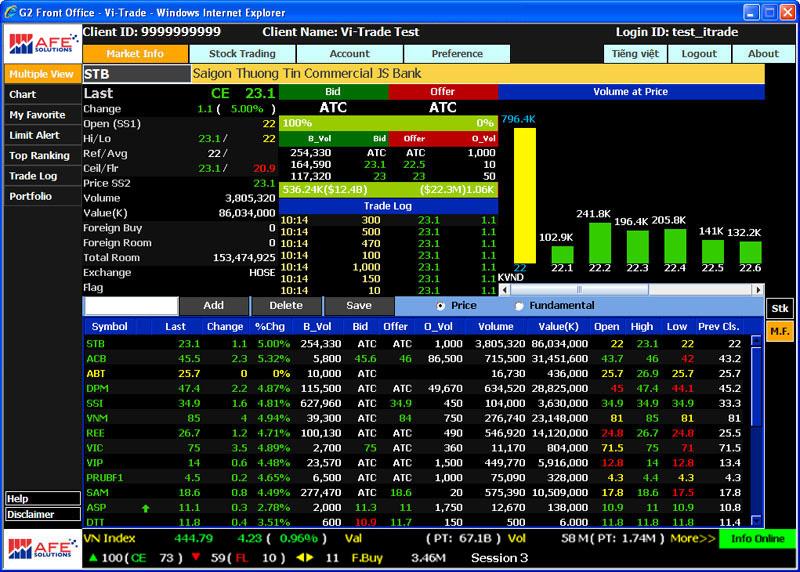
Quote displays real-time data of Stock and Fund instrument. From this menu, you can view data of 2 instruments simultaneously by typing symbol in the symbol entry box  and press Enter e.g. STB and DPM. Click More>> button to view further details.
 Full Quote Full Quote
Displays both real-time price data and foreign trading information.
| Field |
Description |
| Last |
The most recent trade price |
| Change |
The difference between last and previous close (reference price) |
| %Chg |
The difference between last and previous close (reference price) in percentage |
| Open/Open (SS1) |
The opening price |
| High |
The highest price of the day |
| Low |
The lowest price of the day. |
| Ref |
The reference price or previous close. For HASTC market, reference price is the average price of the last trading day |
| Avg |
The average price of the day |
| Ceil |
Ceiling price |
| Flr |
Floor price |
| Price SS2 |
The last matched price during session 2 (HOSE only) |
| Bid Vol 4+ |
Remaining bid quantity beside the highest three bids |
| Offer Vol 4+ |
Remaining offer quantity beside the highest three offers |
| Volume |
Accumulated trading volume of the day |
| Value (K) |
Accumulated trading value of the day. Display in 1000 VND |
| Foreign Buy |
Cumulative buy volume of foreign investors |
| Foreign Sell |
Cumulative sell volume of foreign investors |
| Foreign Room |
Remaining room that foreign investors can buy |
| Total Room |
Total room that foreign investors allow to buy |
| Exch |
Stock exchange which instruments are traded |
| Flag |
Security status flag – Halt, Suspend |
| Field |
Color |
Description |
| Last, Change, %Chg |
Green
Yellow
Red |
Last > Previous Close
Last = Previous Close
Last < Previous Close |
| CE |
Green |
Last = Ceiling |
| FL |
Red |
Last = Floor |
| Open, High, Low, Average |
Green
Yellow
Red |
Price > Previous Close
Price = Previous Close
Price < Previous Close |
 3Bid/3Offer 3Bid/3Offer
Displays real-time 3 best bid and 3 best offer prices and volumes of a particular instrument. Vi-Trade presents data with the following color codes. Strength Bar Indicator illustrates % Bid/Offer, Absolute Bid/Offer Volume and Value of such instrument in real-time.
| Field |
Description |
| Bid |
Bid price. Top 3 best bid price |
| B_Vol |
Bid volume. Top 3 best bid volume |
| Offer |
Offer price. Top 3 best offer price |
| O_Vol |
Offer volume. Top 3 best offer volume |
| %Bid |
%Bid volume %Bid = Sum (Bid Volume)*100/Sum (Bid Volume and Offer Volume) |
| %Offer |
%Offer volume %Offer = Sum (Offer Volume)*100/Sum (Bid Volume and Offer Volume) |
| Absolute Bid Volume |
Summation of best bid volume |
| Absolute Bid Value |
Summation of best bid value |
| Absolute Offer Value |
Summation of best offer value |
| Absolute Offer Volume |
Summation of best offer volume |
| Field |
Color |
Description |
| Bid/Offer price and volume |
Green |
Price > Previous Close |
| |
Yellow |
Price = Previous Close |
| |
Red |
Price < Previous Close |
Click on Bid/Offer label will pop-up Limit Alert dialog.
 Trade Log Trade Log
Presents all executed transactions of such instrument in real-time.
| Field |
Description |
| Time |
Transaction time |
| Volume |
Matched volume (shares) |
| Price |
Matched price (1,000 VND) |
| Flag |
Transaction type (P = Put Through and U = ATO/ATC) |
| Change |
The difference between matched price and previous close (reference price) |
Click on Trade Log bar will pop-up Limit Alert dialog.
 Volume at Price Volume at Price
Illustrates all executed transactions at each price in histogram chart.
| Color |
Description |
| Green |
Price > Previous Close |
| Yellow |
Price = Previous Close |
| Red |
Price < Previous Close |
Click on Volume at Price bar will toggle to Analytic Data pane.
 Analytic Data Analytic Data
Click on Analytic Data bar will toggle to Volume at Price pane. Analytic Data panel provide analytical information as below.
| Field |
Description |
| %Chg 1W |
%Change in 1 week period |
| %Chg 1M |
%Change in 1 month period |
| %Chg 3M |
%Change in 3 months period |
| %Fluct |
Percent fluctuation |
| 52Wk Hi |
52-Week high. The highest price a security reached during the last 52 weeks |
| 52Wk Lo |
52-Week low. The lowest price a security reached during the last 52 weeks |
| P/E |
Price/Earning ratio |
| EPS (K) |
Earning per share in 1,000 VND |
| DPS (K) |
Dividend per share in 1,000 VND |
| Yield |
Dividend Yield |
| Issued Shares |
Issued and shares outstanding. Authorized shares which have been distributed and which may now trade in the market. |
| Market Cap |
Market capitalization. The value of a company as measured by the value of its total paid up equity securities at a market price. |
Click  button to change the lower pane to My Favorite window. button to change the lower pane to My Favorite window.
When you are in My Favorite window, click  button to change the lower pane to Quote view . button to change the lower pane to Quote view .
Back to top
|